

Lifecycle Reports help you track your Contacts’ journey from a new lead to a paying customer (or lost) by visualizing their progression through defined funnel stages. These reports answer key questions such as:
How well is your business doing at converting new leads to paying customers?
Where and why do contacts drop off?
How fast are you at converting customers?
Who or what moved each Contact between stages, and when?
What Are Lifecycle Reports?
Lifecycle Reports are designed to give you a clear picture of your contacts’ progression through the sales or customer journey. We use a funnel model where each Contact:
Enters the funnel: When a Contact is first assigned a lifecycle stage.
Moves through stages: Such as New Lead, Hot Lead, Payment, and finally, the Won (or Customer) stage.
Exits the funnel: Either by reaching the Won stage (as a paying customer), by moving into a Lost stage (drop-off), or by having their Lifecycle stage cleared (becomes empty). Once a Contact no longer has any assigned stage, they’re considered to have exited the funnel.
Contacts that never enter this funnel are excluded from the metrics. This ensures that only active lifecycle journeys are tracked, giving you an accurate view of conversion and drop-off rates as well as timing metrics.
How Does It Work?
When Your Lifecycle Journey Starts
Once a Contact receives their very first Lifecycle stage, we start capturing their progress in all related reports. The date of that initial stage assignment is recorded as the “funnel entry” date for every metric that follows.
For instance, if a new lead is assigned a New Lead stage on February 1st, that date marks the start of Lifecycle tracking for that Contact. All conversions, drop-offs, and time-based calculations tie back to this original funnel entry date.
Every Stage Matters
Every time a contact changes stages, that movement is logged—whether they move forward, skip stages, or move backward.
For example, if a contact moves from Stage 1 to Stage 3, then directly to the Won stage, the system tracks that Stage 2 was skipped but still logs that the contact effectively passed “through” Stage 2. This ensures the funnel accurately reflects each stage transition, even when skipped. Any time spent in a skipped stage (like Stage 2) isn’t reflected in Lifecycle Reports.
Returning to the Funnel
A lifecycle journey begins the very first time a Contact is assigned any Lifecycle stage (for example, Stage 1) and ends when they ultimately reach a Won Stage or a Lost Stage. If a Contact leaves at a Lost Stage but comes back later (e.g., gets reassigned to Stage 1 again), we treat that as a new journey—complete with a new start date.
For example, a Contact might move from Stage 1 to Stage 3 and eventually land in a Lost Stage, ending their first journey; then, weeks later, the same Contact could be requalified and assigned Stage 1 again. This second assignment is considered a fresh journey, letting you track how they progress (or drop off) the second time around.
Visualizations & Metrics
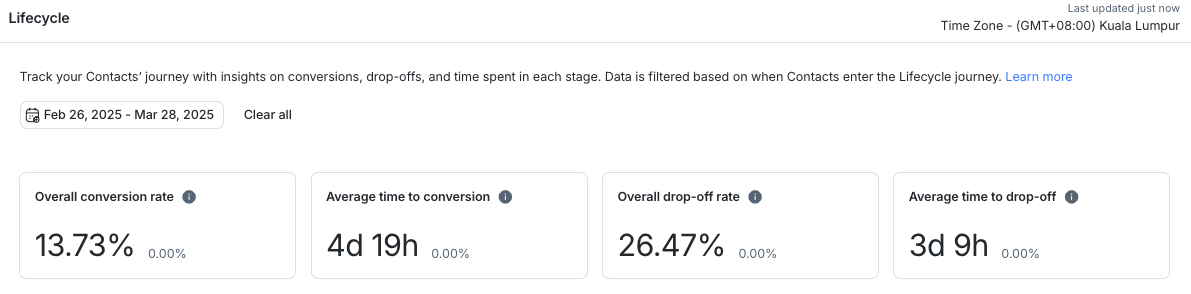
Your Lifecycle Reports dashboard displays key metrics that reveal how effectively contacts move through the funnel. Here’s a breakdown of each metric and why it matters:
Overall Conversion Rate
What It Tells You:
The percentage of contacts who successfully reach the Won stage out of all contacts that entered the funnel.
Why It Matters:
Indicates the health and effectiveness of your sales process.
Helps identify if certain stages are causing major drop-offs.
Example:
If 100 contacts enter the funnel and 40 reach the Won stage, your overall conversion rate is 40%.
A high conversion rate typically means your follow-up and nurturing strategies are successful.
Average Time to Conversion
What It Tells You:
How long (on average) it takes for a contact to go from funnel entry to Won stage.
Why It Matters:
Helps you forecast sales cycles and adjust engagement strategies.
Reveals opportunities to streamline processes and shorten the sales cycle.
Example:
If Contact A converts in 2 days, Contact B in 4 days, and Contact C in 6 days, the average time to conversion is 4 days.
Shorter conversion times often mean a more efficient sales process.
Overall Drop-Off Rate
What It Tells You:
The percentage of contacts that end up in any Lost stage rather than converting.
Why It Matters:
Highlights where leads disengage or abandon the process.
Allows you to pinpoint bottlenecks and take targeted actions (e.g., re-engagement strategies).
Example:
If 100 contacts enter the funnel and 30 move to a Lost stage, the drop-off rate is 30%.
A high drop-off rate suggests there may be bottlenecks or misalignments in your funnel that need attention.
Average Time to Drop-Off
What It Tells You:
The average time it takes for a contact to exit the funnel by reaching a Lost stage.
Why It Matters:
Pinpoints if drop-offs happen early or later in the funnel.
Informs where you should adjust messaging, resources, or follow-up timing.
Example:
If on average contacts drop off 2 days after first entering the funnel, you know early-stage engagement needs improvement.
Conversely, if the average time to drop off is very long your team may be dedicating excessive time and effort to leads that ultimately don’t convert, signaling a potential need for more efficient qualification or nurturing strategies.
Identifying when drop-offs occur helps you focus on specific stages for retention efforts.
Using Lifecycle Reports with Paid Ads
If you’re running Meta Click-to-Chat Ads or TikTok Messaging Ads, you can now combine ad source attribution with Lifecycle stages to get deeper insights into lead quality and funnel performance.
You can now:
Filter Lifecycle Reports by:
Ad Campaign
Ad Group
Ads
Group the Lifecycle Funnel chart by:
Ad Campaign
Ad Group
Ads
Source (which now includes “Paid Ads” with sub-sources for Meta and TikTok)
These filters and grouping options let you:
Track how many ad-sourced contacts reach stages like
Qualified, Paying Customer, or Cold Lead
Compare performance across campaigns to see which ads bring in leads that actually progress through your funnel
Identify drop-offs by campaign to optimize targeting or messaging strategies
Tip: Contacts that don’t come from any ads will appear as No Campaign, No Ad Group, or No Ad in the grouped charts.
Filtering by Stage Transitions and Change Sources
Four filters help you narrow down who or what moved Contacts between stages. They appear below the Page URL filter.
Filter | Values | Applies to |
|---|---|---|
Stage transition - From | Your Lifecycle stages | Lifecycle Transitions Log only |
Stage transition - To | Your Lifecycle stages | Lifecycle Transitions Log only |
Changed by User or AI Agent | All user and AI Agent names | All charts and tables |
Changed By Source | User, AI Agent, Workflow, Developer API, Make, n8n, Zapier, System | All charts and tables |
Note: The Changed by User or AI Agent and Changed By Source filters only include stage changes made from 6 October 2026.
For example, select an AI Agent under Changed by User or AI Agent to see the conversion and drop-off metrics for stage changes that AI Agent made. Compare the results with the same filter set to a user.
Note: The System source only appears when a Contact is automatically assigned the default Lifecycle stage.
Getting Started with Lifecycle Reports
To start using Lifecycle Reports, follow these practical steps:
1. Enable the Lifecycle Feature
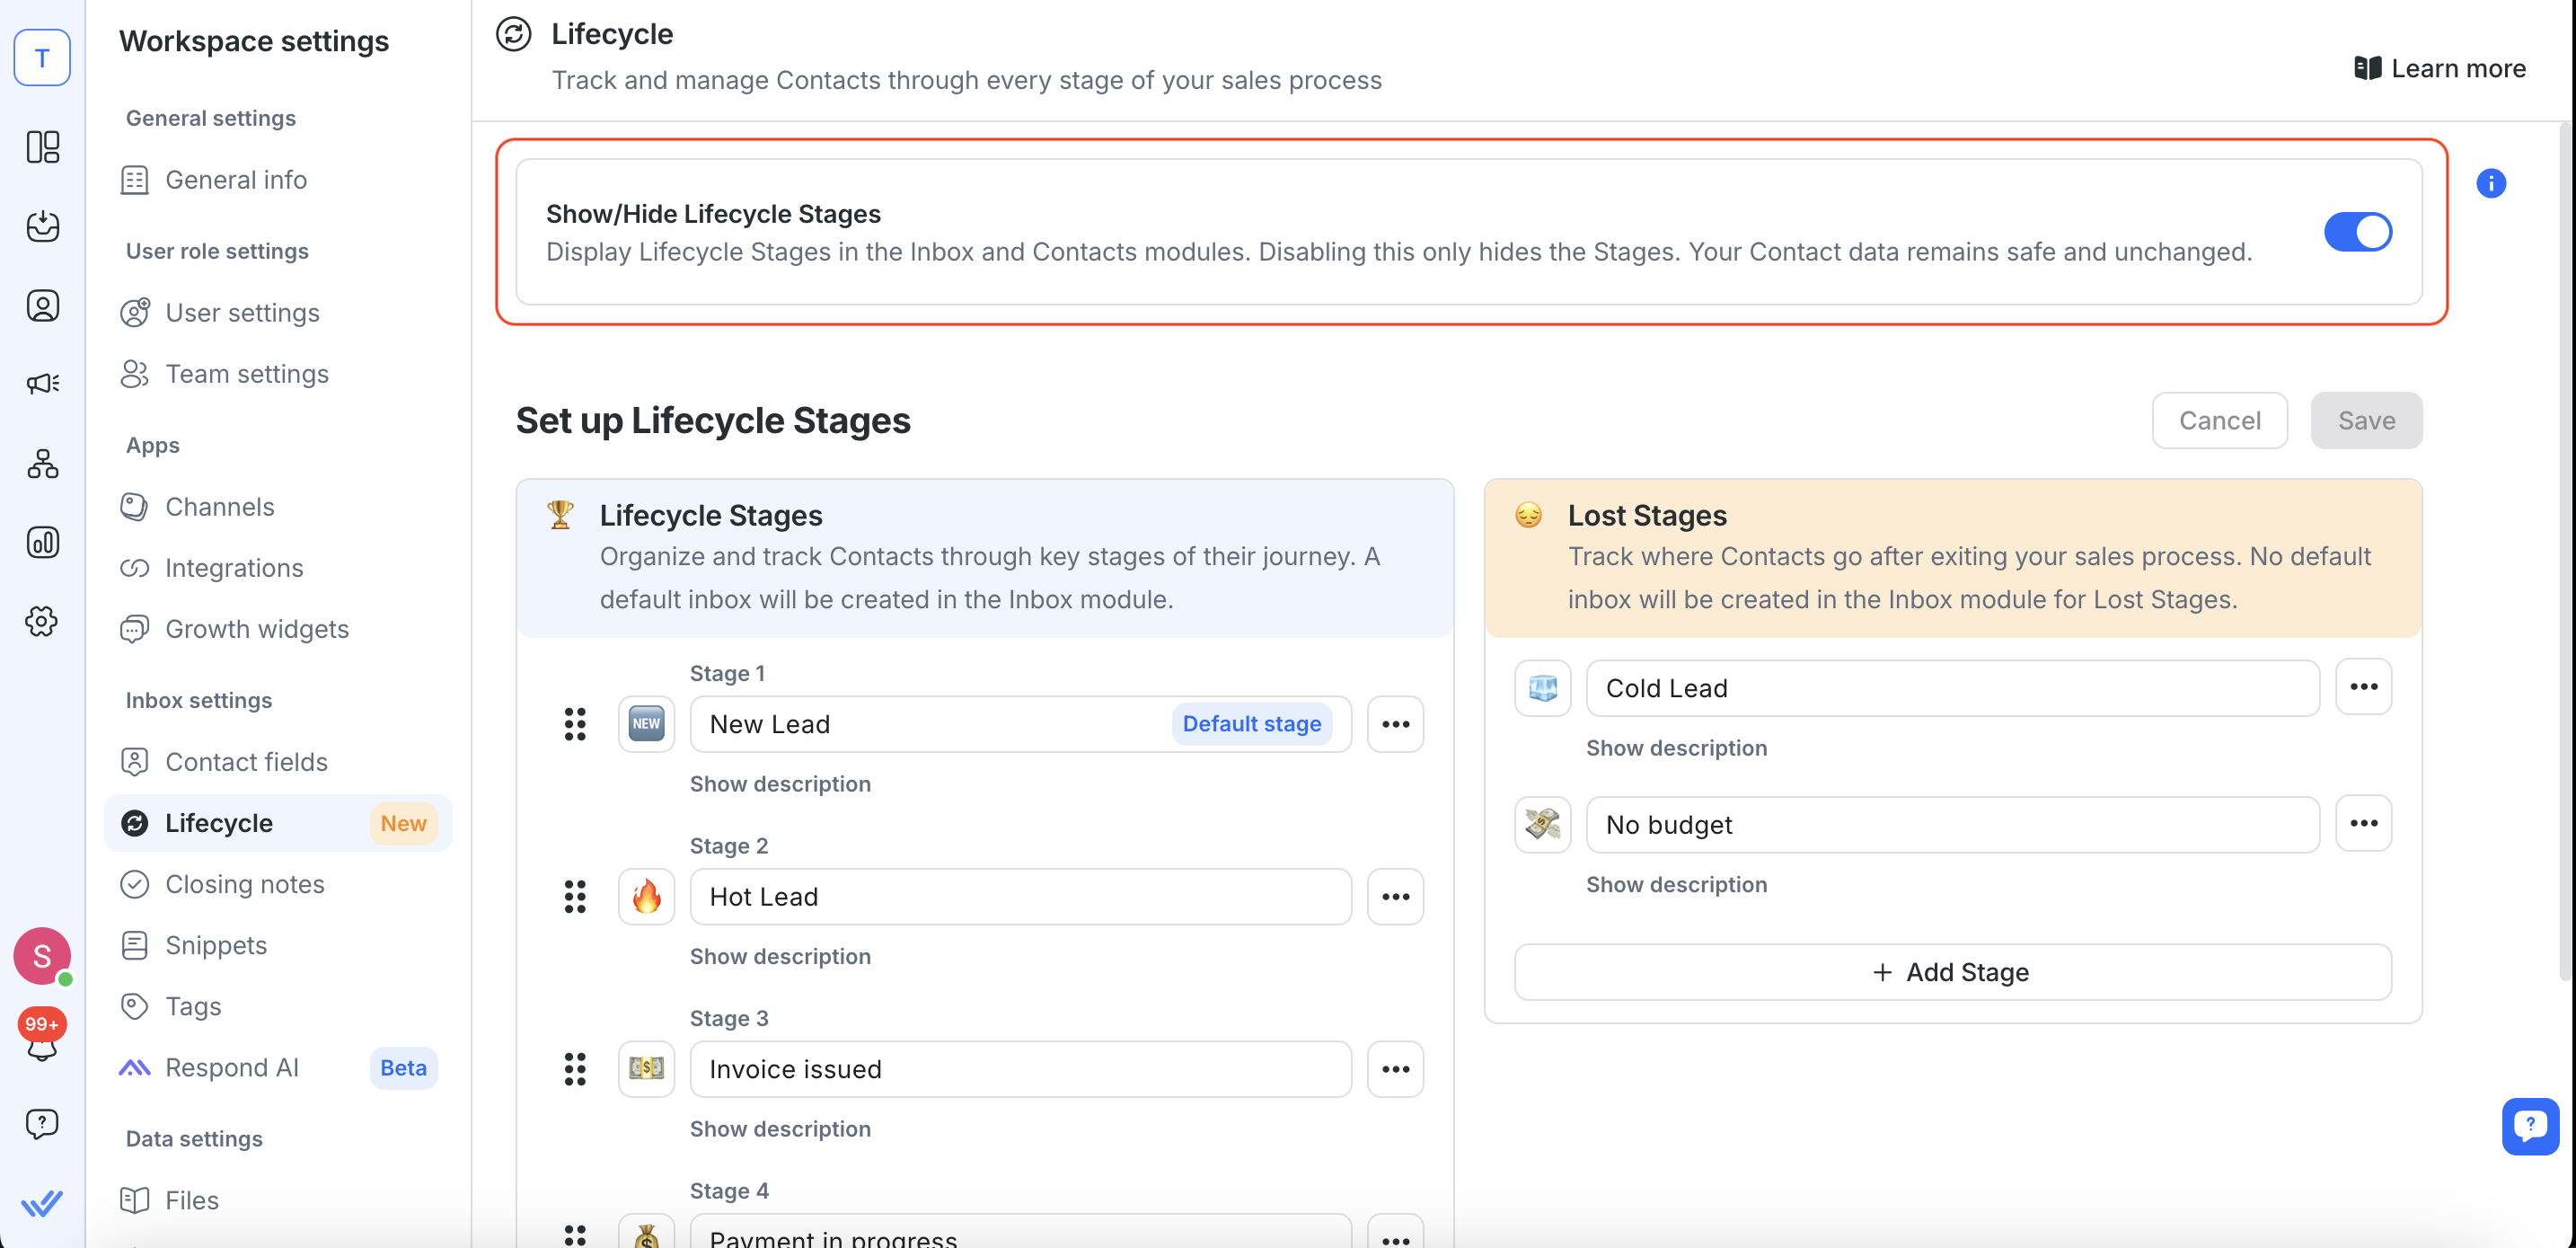
Navigate to your workspace settings.
If Lifecycle is not enabled, turn on the Show/Hide Lifecycle Stages toggle to enable it.
Learn more about our Lifecycle feature here.
2. Access the Reports Module
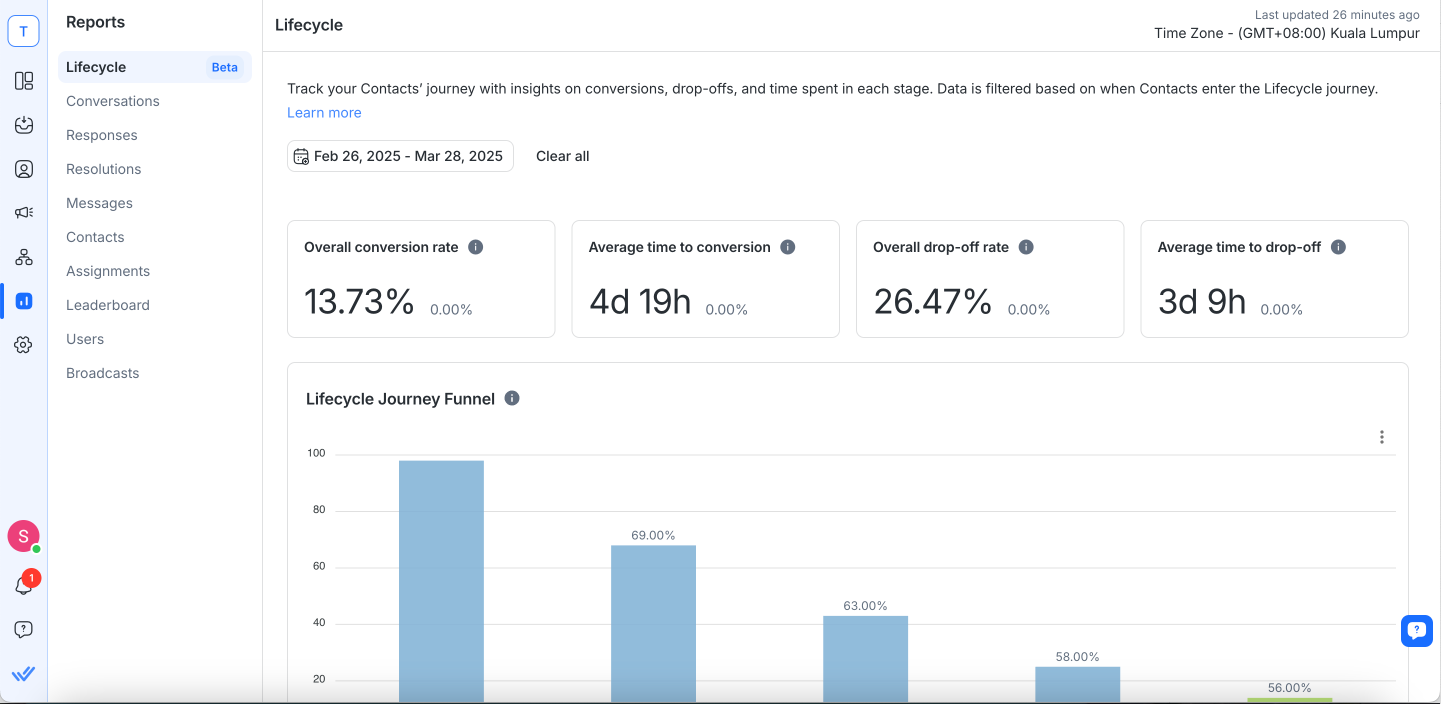
Once Lifecycle is active, go to the Reports section and select Lifecycle.
The Lifecycle report page will default to a pre-selected date range (e.g., the last 14 days).
3. Configure Date Filters
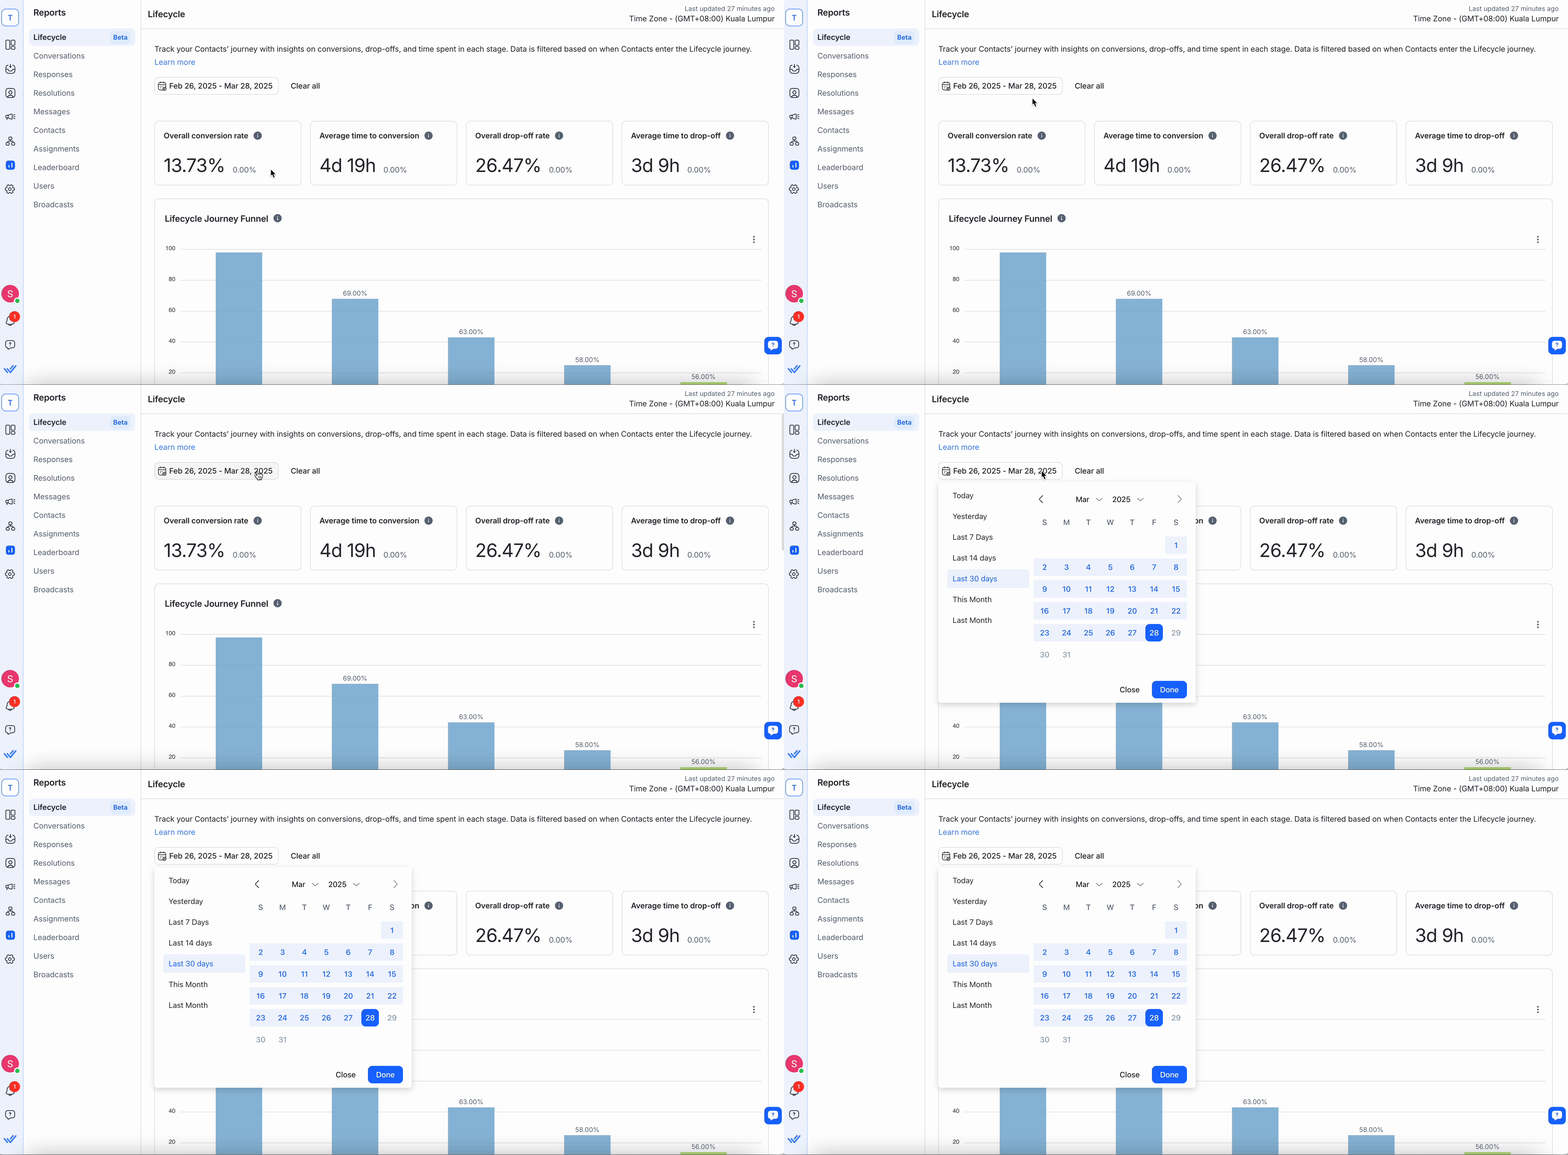
Use the Date Picker to choose when contacts first entered a lifecycle stage. Only those who began their lifecycle journey during this period are included in the report.
Options include Today, Yesterday, Last 7 Days, Last 14 Days, Last 30 Days, etc.
Note: Because this date filter applies to the start of a contact’s journey, any contacts who entered a stage before (or after) the selected date range will not appear in the metrics.
4. Review and Interpret Metrics
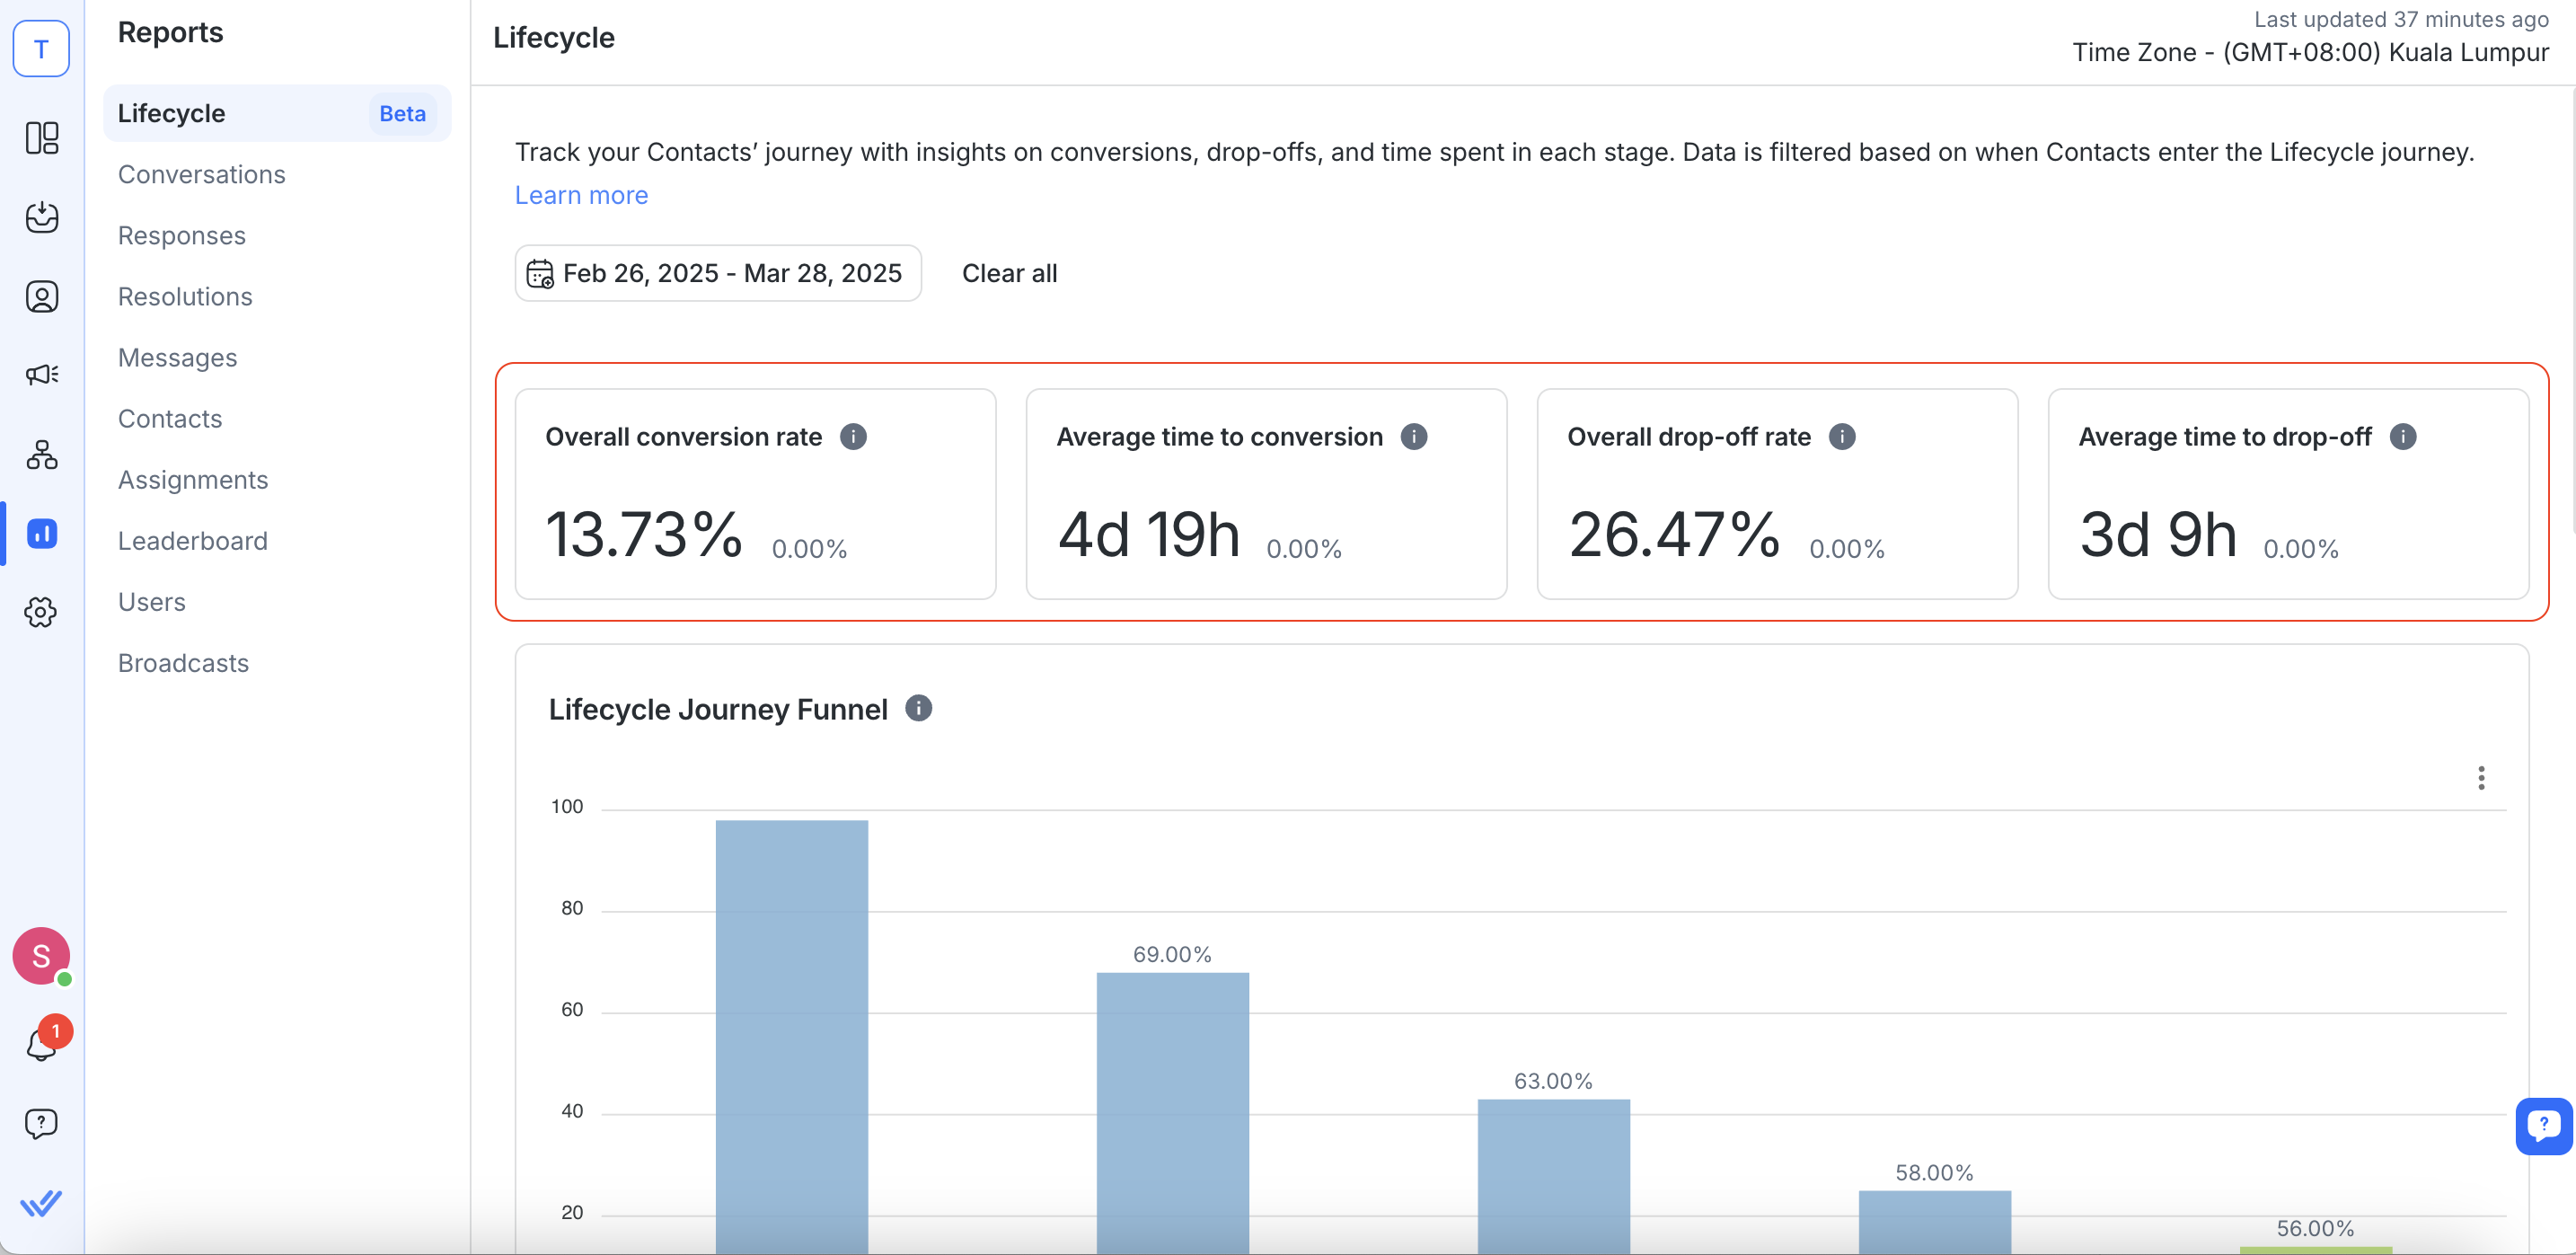
Study the conversion and drop-off metrics on the dashboard.
Hover over charts and cards for callouts that explain each metric in detail.
Using Lifecycle Reports
After setting up, here’s how you can use Lifecycle Reports to optimize your business:
Monitor Conversion and Drop-Off Rates
Review the overall conversion and drop-off rates to assess your sales performance.
Compare current metrics with previous periods (using percentage differences) to gauge trends.
Locate and Understand Your Drop-Off Points
Identify Where They Drop Off: The report shows which stage contacts exit from, helping you pinpoint the exact point in your funnel where leads are disengaging.
Understand Why They Drop Off: By reviewing destination Lost stages (e.g., “No Budget,” “Not Interested,” etc.), you gain clarity on the most common reasons for lost opportunities.
Actionable Insights: If a significant number of contacts drop off from Stage 2 with “No Budget,” you can refine your qualification process or tailor outreach strategies to address that specific objection. This targeted approach helps reduce overall drop-offs and improves funnel efficiency.
Analyze Time-to-Conversion and Time-to-Drop-Off
Identify how long contacts remain idle in each stage.
Use these insights to determine if your follow-up strategies are effective or if certain stages need improvement.
Leverage Visualizations
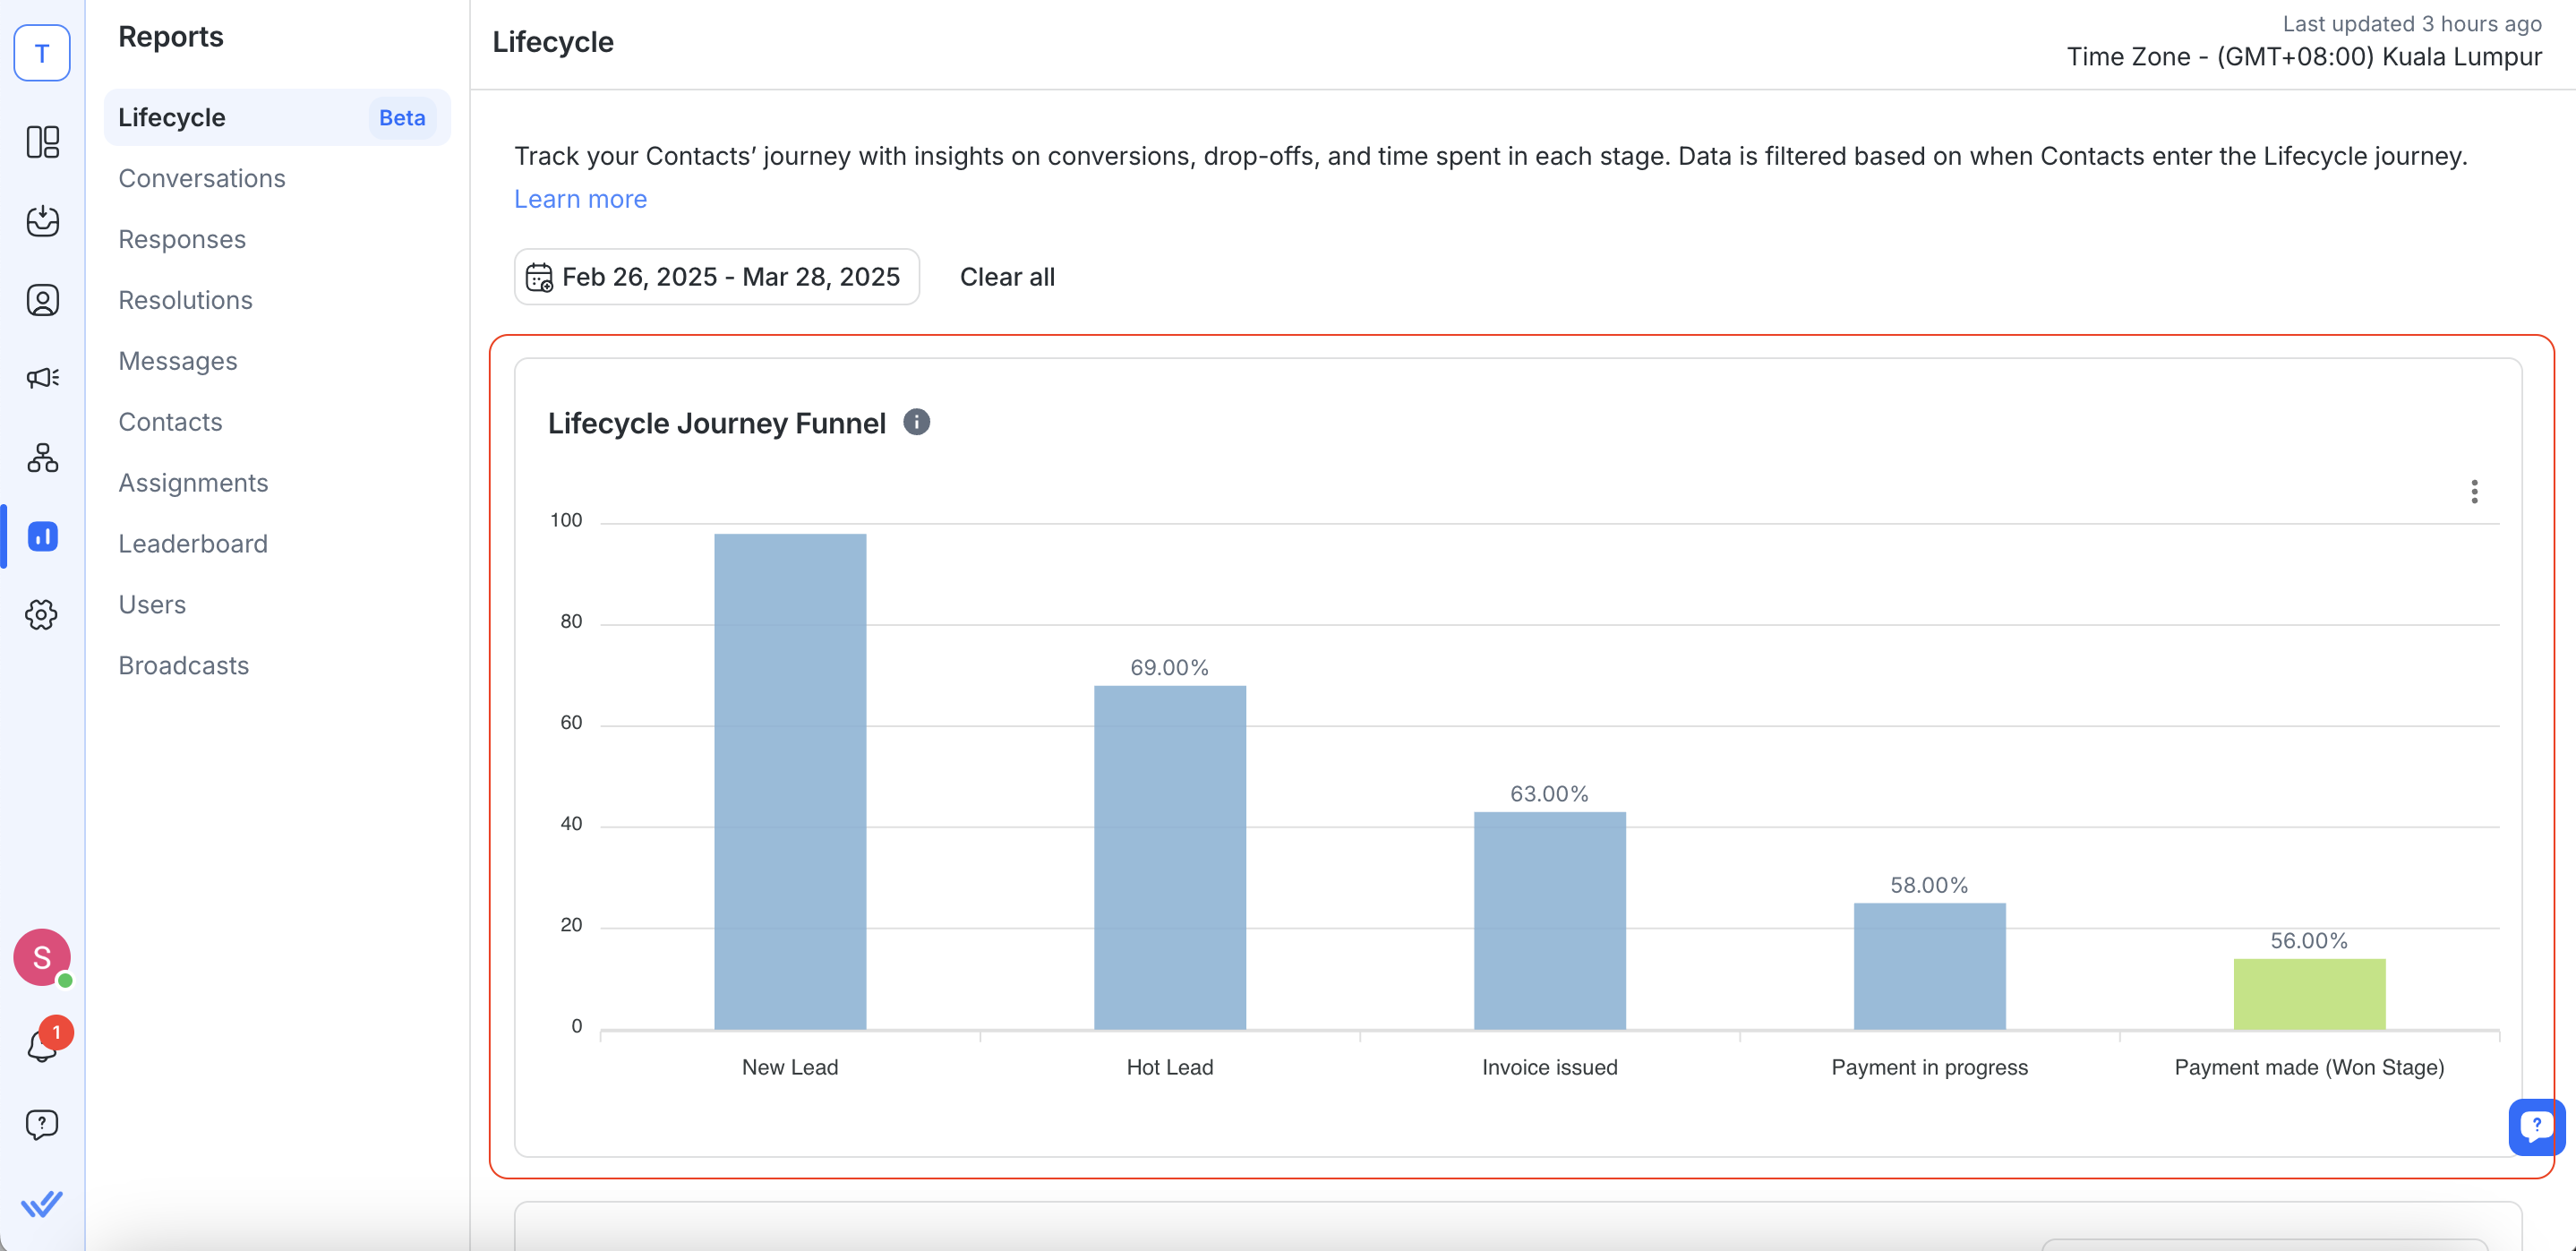
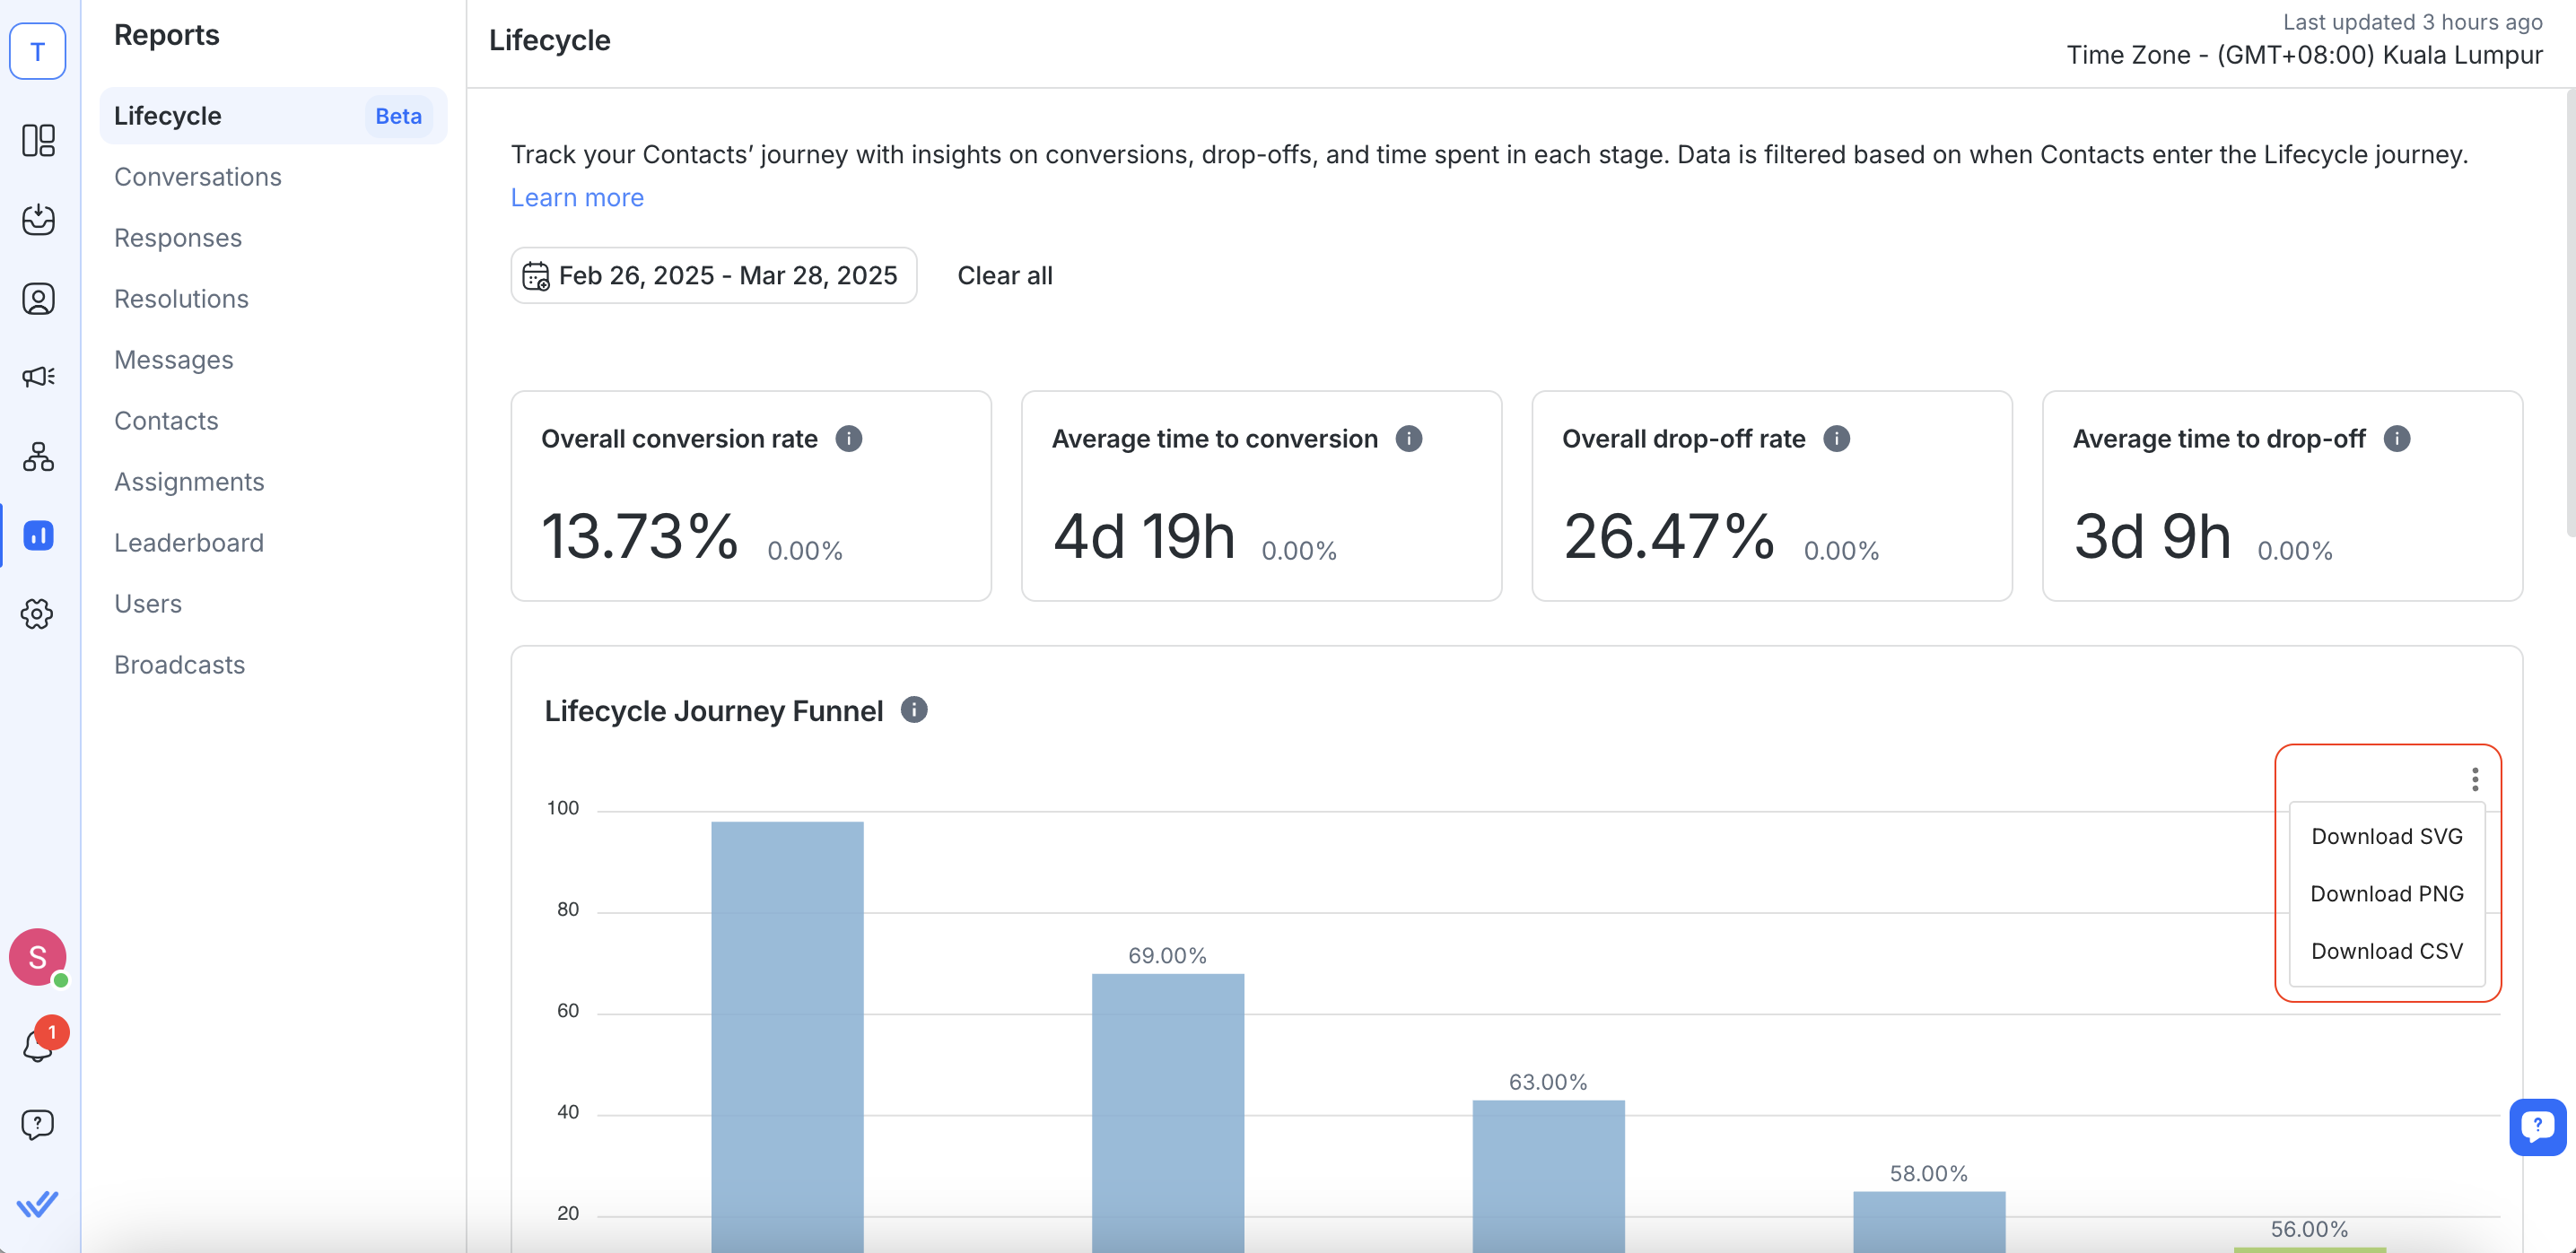
The Lifecycle Journey Funnel graph shows you the number of contacts at each stage.
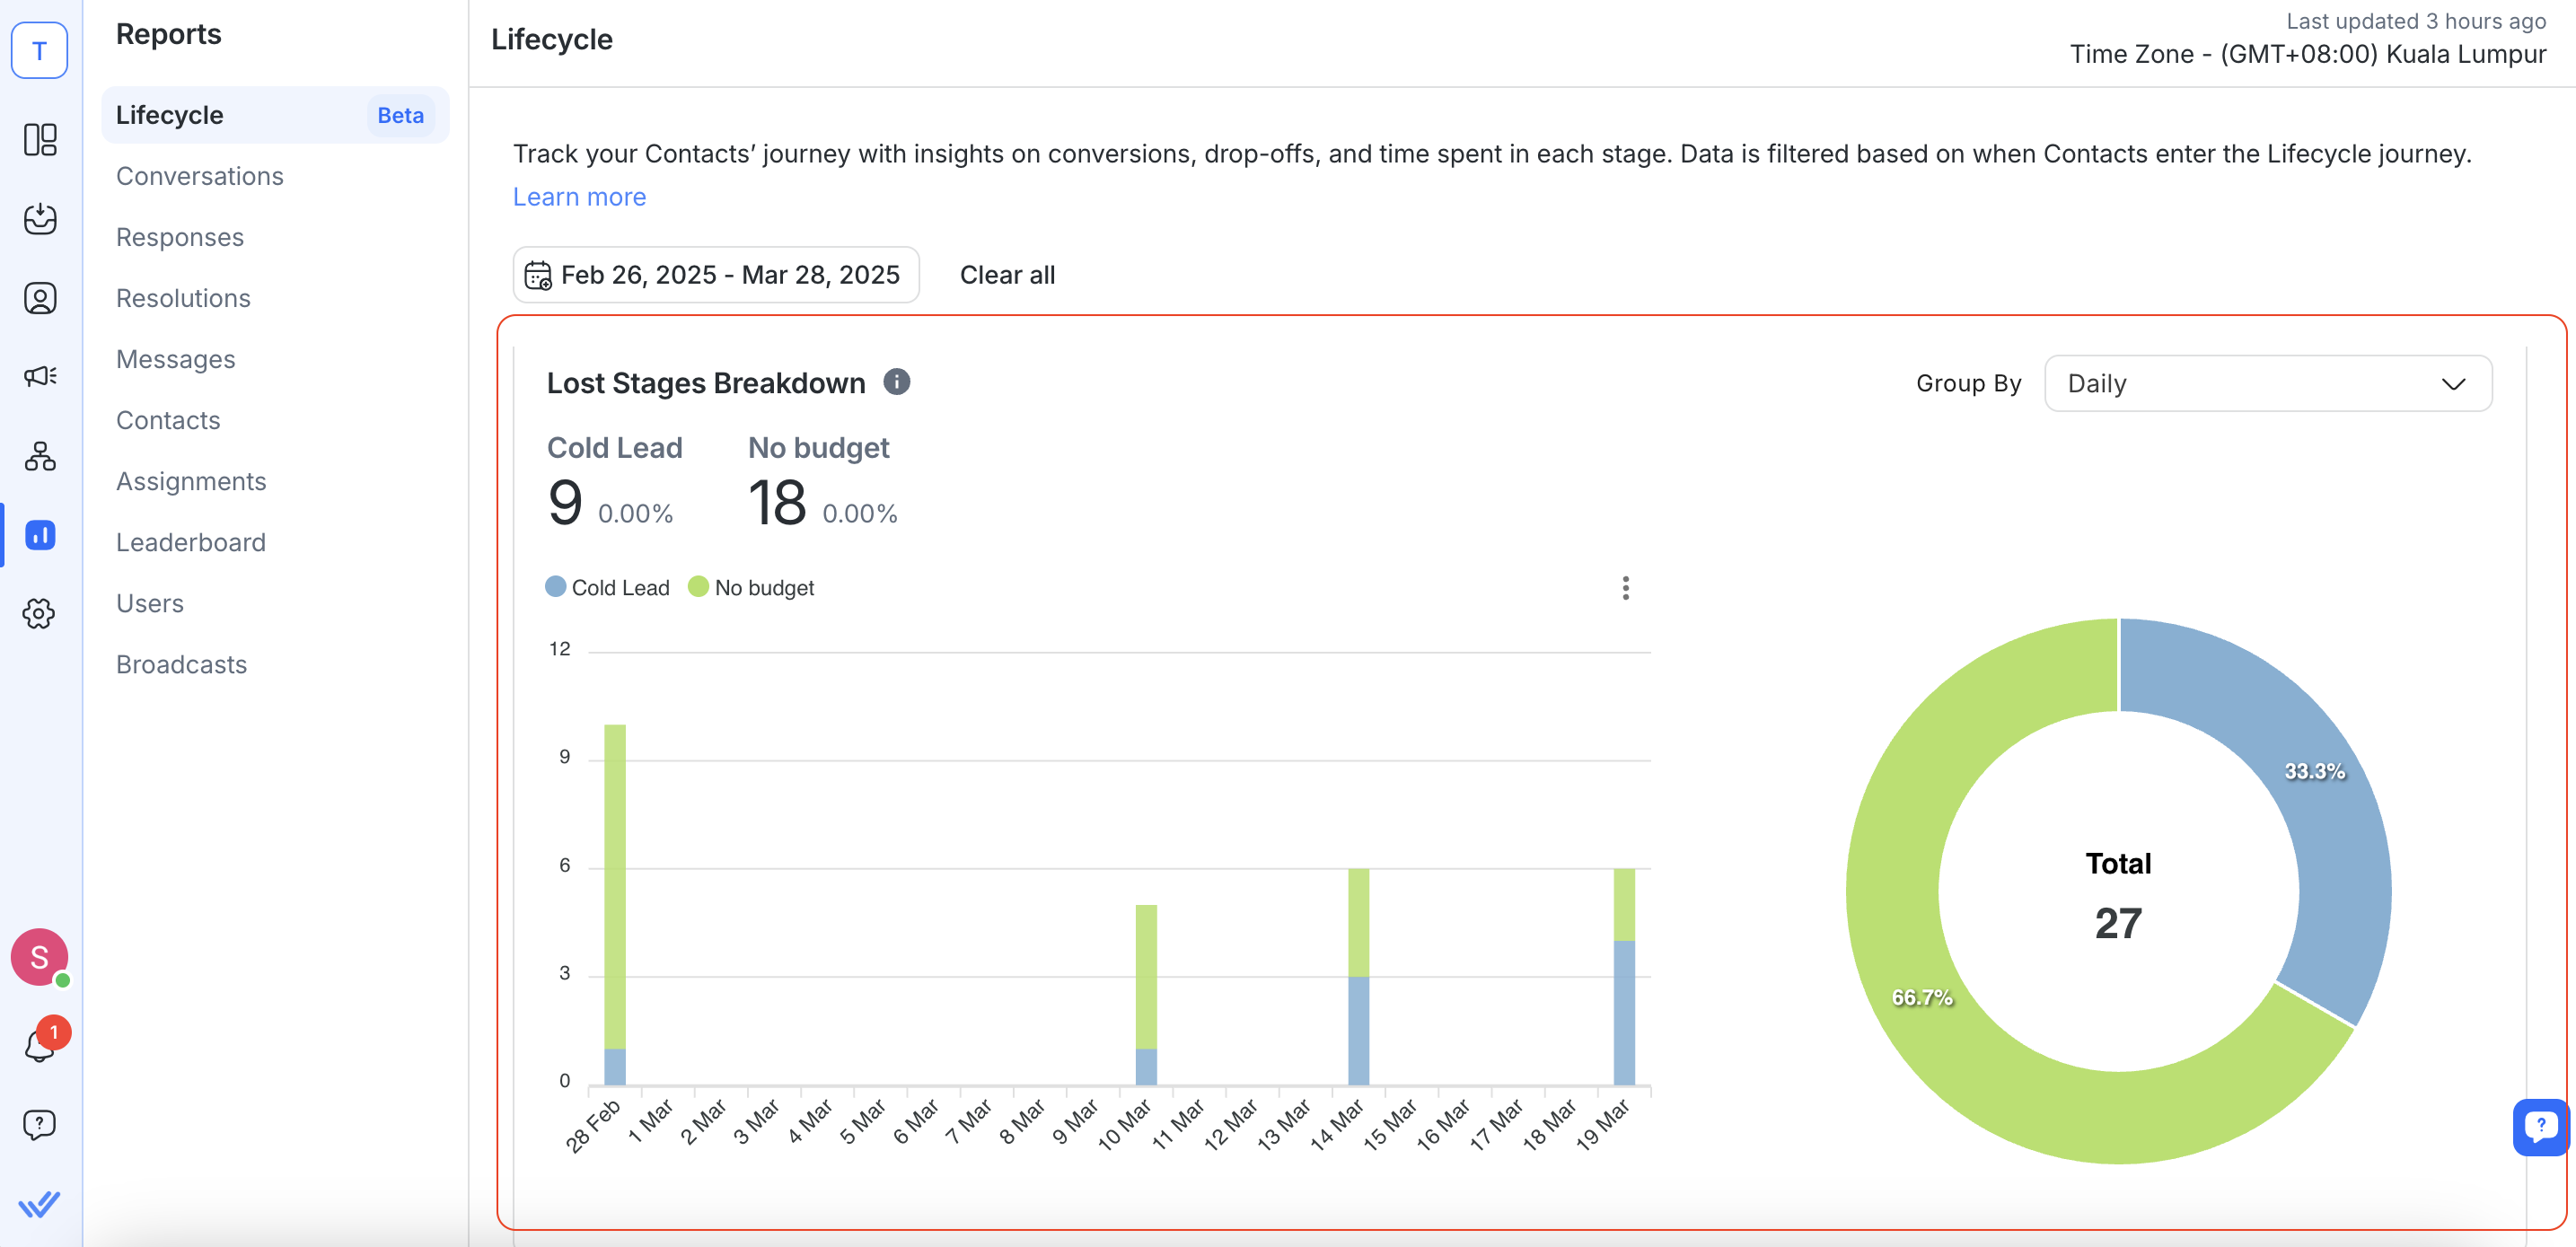
The Lost Stages Breakdown chart helps you pinpoint which lost stages are most common.
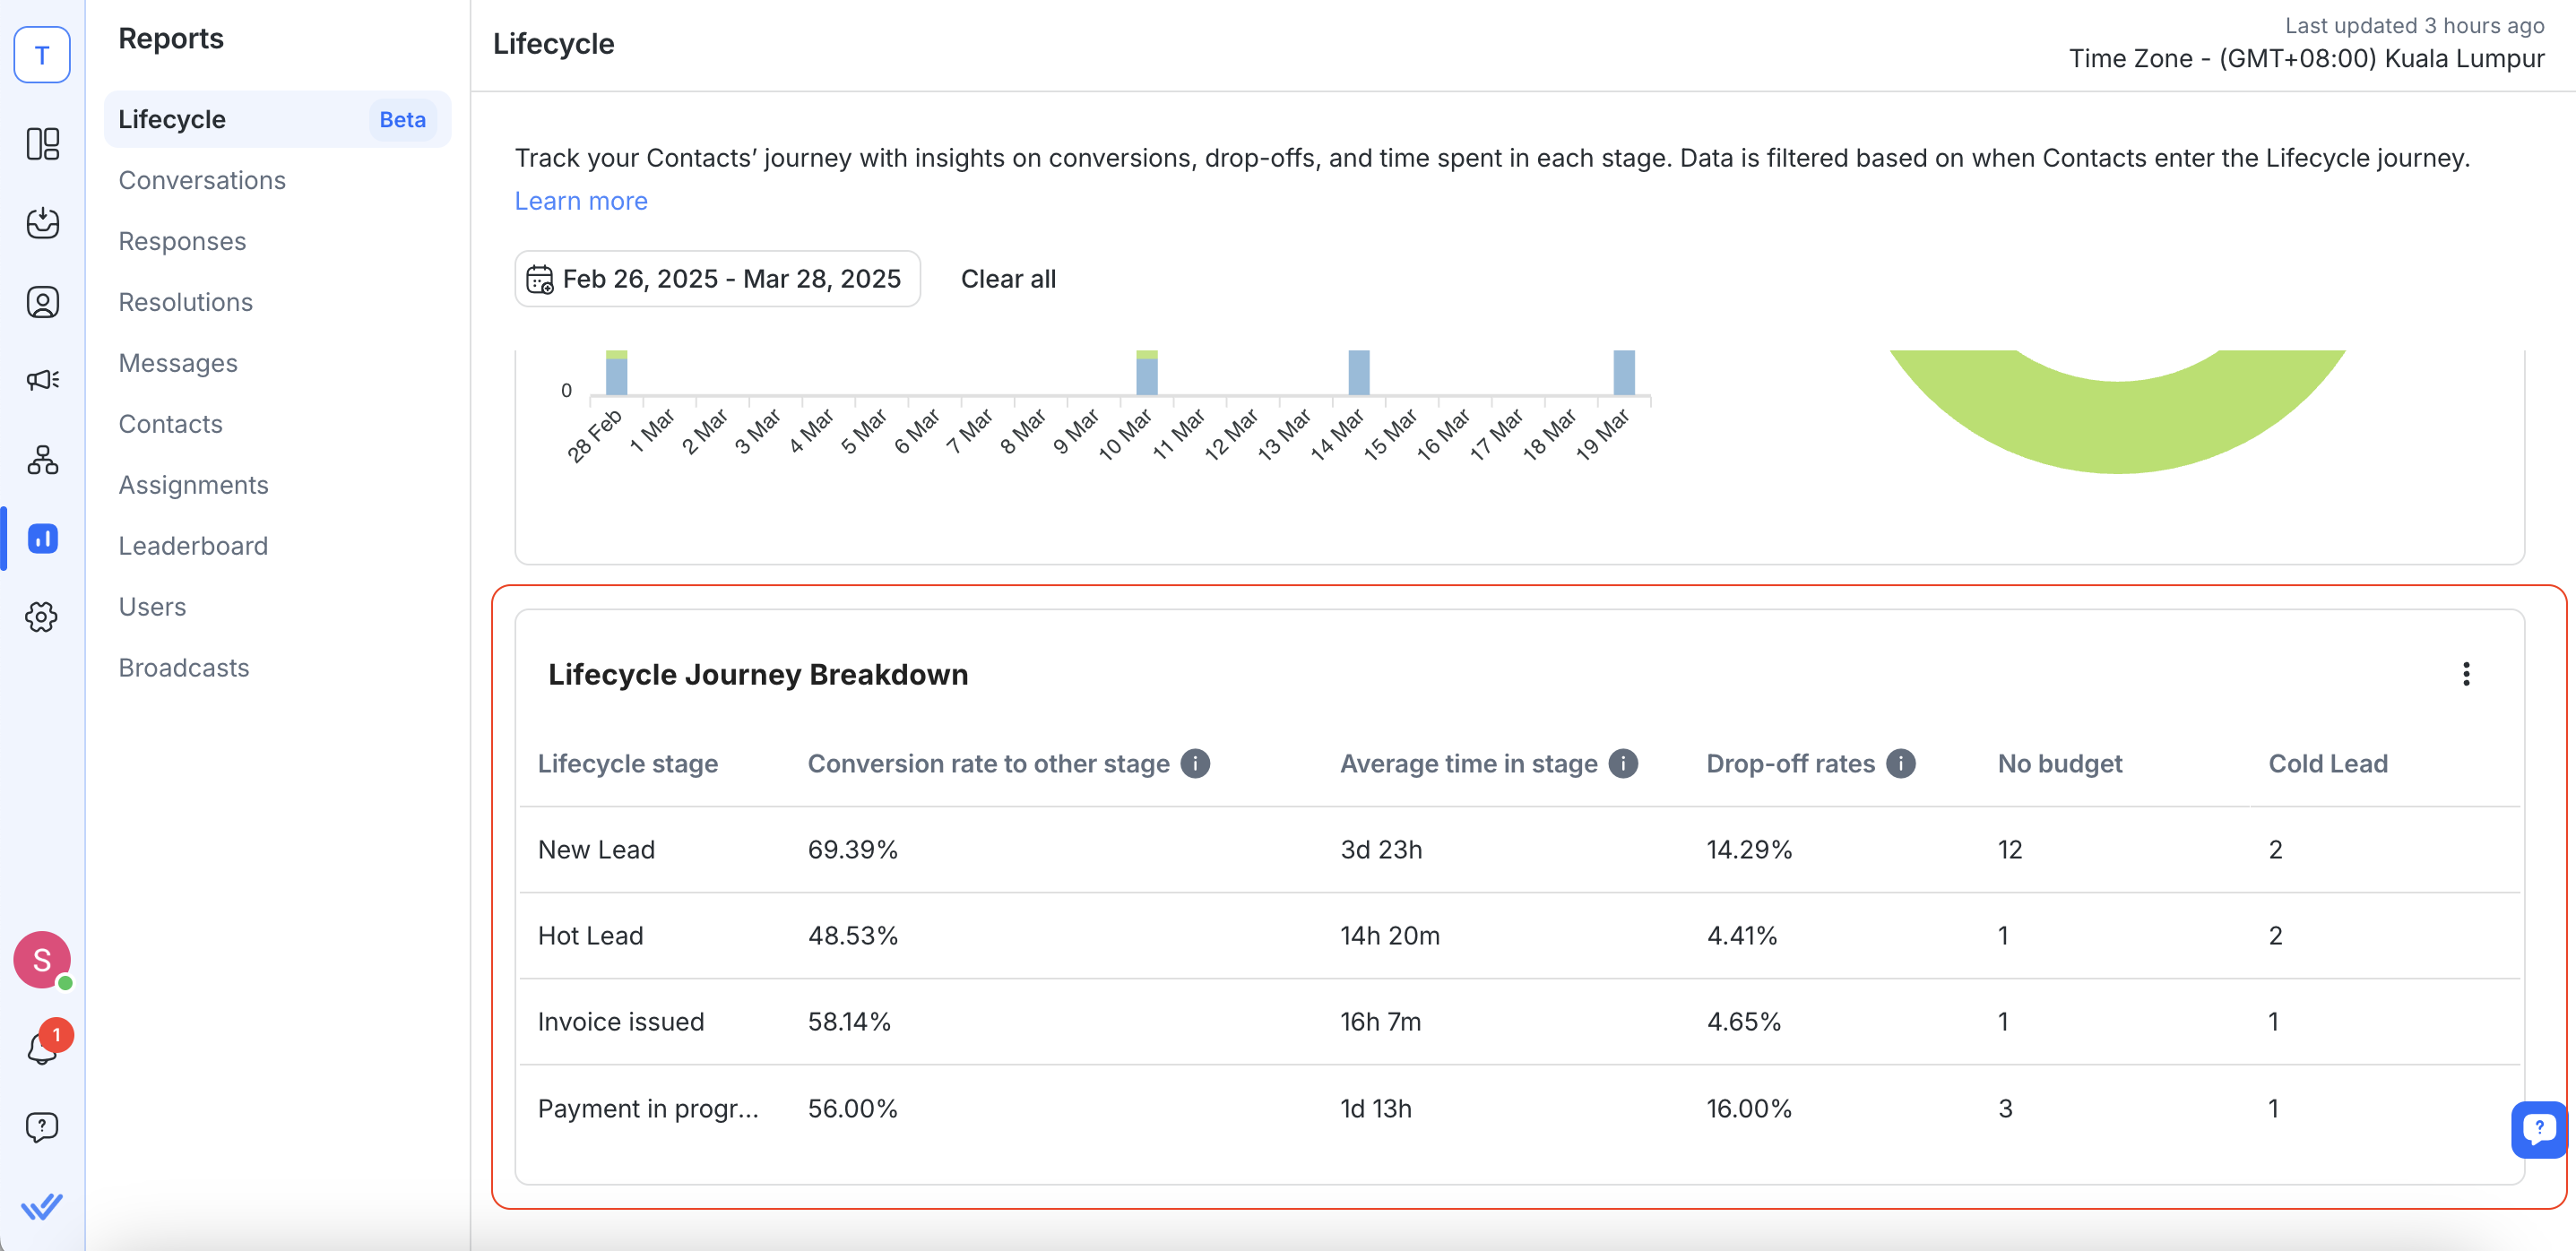
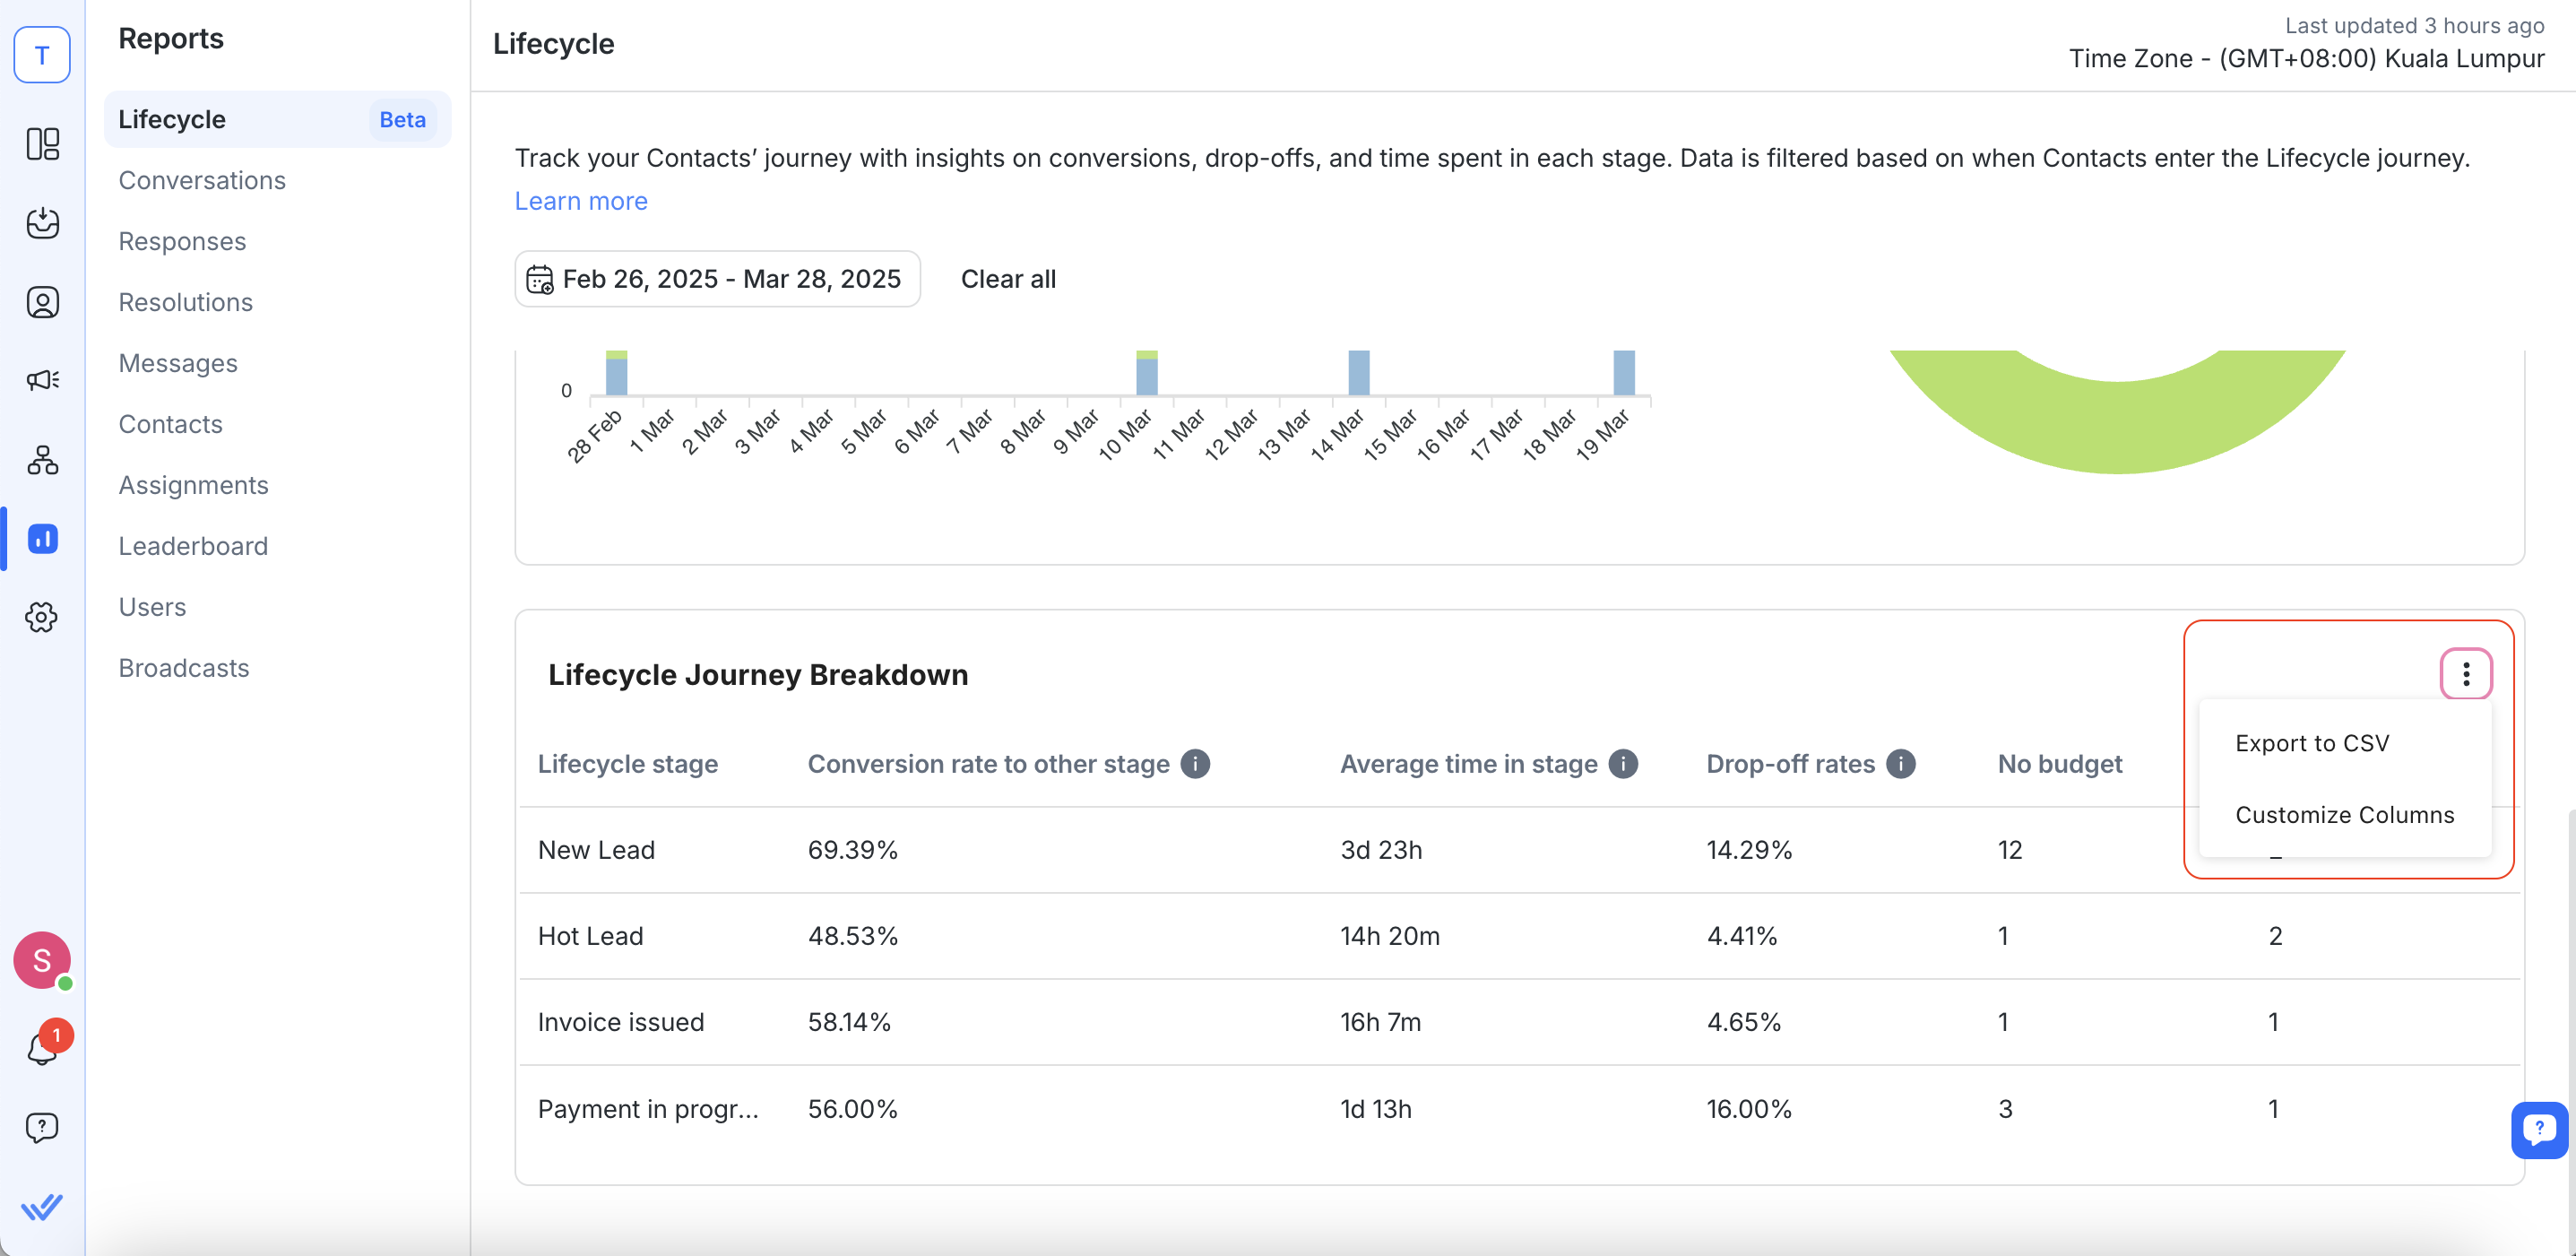
A detailed Breakdown Table offers granular data on:
Conversion rates per stage
Average time spent in each stage
Drop-off destinations (which Lost Stage contacts move to)
Common drop-off reasons (e.g., “No Budget,” “Not Interested”)
Lifecycle Transitions Log
The Lifecycle Transitions Log at the bottom of the Lifecycle report lists every stage change for each Contact. Each row is one transition. The most recent transitions appear first. Transitions with the same timestamp, such as rapid back-to-back changes, may not appear in the exact order they happened.
Column | Description |
|---|---|
Contact name | The Contact's name. Click it to open their conversation. |
Contact ID | The Contact's ID. |
From Stage | The stage the Contact was in before the change. When a Contact moves from a Won stage to a Lost stage, this column shows “No Previous Stage”. The move starts a new lifecycle journey, so there's no earlier stage to show. |
To Stage | The stage the Contact moved to. |
Date Entered | When the Contact entered the new stage. |
Changed By Source | What made the change: a user, AI Agent, Workflow, Developer API, Make, Zapier, n8n, or System. System only appears when a Contact is automatically assigned the default Lifecycle stage. |
Changed By | Who made the change: the user's name or the AI Agent's name. |
Ad Campaign | The ad campaign the Contact came from. Blank if the Contact didn't come from a paid ad. |
Ad Group | The ad group the Contact came from. Blank if the Contact didn't come from a paid ad. |
Ads | The ad the Contact came from. Blank if the Contact didn't come from a paid ad. |
Widget Name ID | The ID of the Growth Widget the Contact came from, if applicable. |
Website | The domain the Contact reached out from, if applicable. |
Page URL | The specific page the Contact reached out from, if applicable. |
Note: The Changed By and Changed By Source columns only show data for stage changes made from 6 October 2026. For earlier changes, these columns are blank. All other columns include past stage changes.
How transitions are logged
Each step is its own transition. Moving a Contact from Stage 1 to Stage 3 adds 2 rows: Stage 1 → Stage 2 and Stage 2 → Stage 3.
Clearing the stage of a Contact in an active stage adds a row for each step back to the first stage, then a final row to “No stage”. For example, clearing Hot Lead adds 2 rows: Hot Lead → New Lead and New Lead → “No stage”.
Moving a Contact directly from one Lost stage to another, such as Lost Lead → Cold Lead, doesn't add a row to the log.
Clearing the stage of a Contact in a Won or Lost stage doesn't add a row to the log.
Use the log to audit stage changes, check which users or AI Agents move Contacts forward, and trace transitions back to the ads or widgets that brought Contacts in.
Note: Stage changes from bulk imports or bulk assignments don't add rows to the Lifecycle Transitions Log.
Export and Customize Data
Use built-in options to export data to CSV or customize the columns as needed for further analysis. Both the Breakdown Table and the Lifecycle Transitions Log support CSV export and column customization.
Best Practices
Limit Stage Changes
Try not to frequently add, delete, or rearrange lifecycle stages unless necessary. Drastic or repeated changes in stage configuration can disrupt data consistency and affect the accuracy of your reports.
Keep Your Data Updated
Regularly update contact statuses and lifecycle stages. Inaccurate data can skew conversion and drop-off metrics.
Use Default Stages Correctly
Avoid modifying or deleting critical stages like the Won stage. These stages are essential for accurate metric calculations.
Regularly Review Trends
Monitor changes over different date ranges. This can help identify if a campaign is improving conversion speed or if there are persistent drop-offs in specific stages.
Train Your Team
Ensure that everyone responsible for updating contact details understands the importance of logging proper lifecycle transitions.
FAQ and Troubleshooting
What does it mean if my conversion rate is low?
A low conversion rate indicates that fewer contacts are moving from the initial stages to the Won stage. This may suggest that your follow-up process or lead nurturing strategy needs improvement.
Review the stages where contacts are stalling. If a particular stage has both a low conversion rate and a low drop-off rate, it often means contacts are getting stuck there without progressing or exiting.
Check if there are any process bottlenecks or if leads are not being followed up in a timely manner.
How are skipped stages handled?
If a contact bypasses one or more stages and goes directly to a later stage (e.g., directly to the Won or Lost stage), the system treats the movement as a skip. The skipped stages movements are logged in the background to ensure accurate funnel calculations but are excluded from certain time-based metrics.
When does a Contact’s lifecycle journey end and start over?
A Contact’s Lifecycle journey ends the moment they move into a Won stage, a Lost stage, or a cleared (no stage) state. If they later move out of these states and back into a main stage, it’s considered a new journey. This ensures that all subsequent lifecycle movements are captured independently, starting with a fresh funnel entry date.
Confirm that reentered contacts are correctly logged with a new funnel entry date.
Verify that any reengagement strategies are properly documented so you can track improvements over multiple journeys
Can I customize the lifecycle stages?
Yes, you can add new stages (which will appear before the Won stage) and update stage names or descriptions. However, certain stages (like the Won stage) are locked from deletion or movement to maintain reporting accuracy.
Limit Stage Modifications: Frequent or extensive changes (adding, deleting, or reordering) can temporarily cause data inconsistencies, so it’s best to only alter stages when it’s absolutely necessary.
Check Metrics After Changes: If data seems off following a customization, verify that the new stage has been properly integrated and allow some time for the system to stabilize.
Maintain Consistency: Keep in mind that the more consistent your lifecycle configuration remains, the more reliable and accurate your reports will be over time.
My report metrics seem off. What should I do?
If the metrics (such as conversion or drop-off rates) appear inaccurate:
Check Contact Assignments: Verify that all contacts are being assigned the correct stages.
Review Date Filters: Ensure your date filters are set properly and reflect the period you want to measure.
Look for Anomalies in Logs: Check the Lifecycle Transitions Log for sudden spikes or drops in stage changes that might indicate data-entry errors. Use the Changed By and Changed By Source columns to find which user, AI Agent, Workflow, or integration made them.
Account for Recent Stage Changes: If you recently added, deleted, or rearranged any lifecycle stages, the data may appear inconsistent for a short period. It’s best to wait for the data to “cool down”—in other words, allow the system to gather enough new, consistent data under your updated configuration—before drawing conclusions.
How do I export data for further analysis?
You can use the export option available in the Breakdown Table and the Lifecycle Transitions Log (accessed via the kebab menu). This lets you download the report data as a CSV file.
Ensure your browser pop-up blocker is disabled when initiating the export.
If the export fails, try refreshing the page or using a different browser.
How are contact imports, bulk assignments, and stage deletions handled?
Bulk Imports & Assignments:
When contacts are imported or assigned a stage in bulk, the system does not log that action as an “active transition.”
Example: If a contact is in Stage 1 and then bulk-updated to Stage 2 via import, followed later by a user manually updating that same contact to Stage 3, only the Stage 2 → Stage 3 change is recorded as a lifecycle movement. The import-related update (Stage 1 → Stage 2) is not logged.
Stage Deletions:
Removing a lifecycle stage can temporarily skew your metrics, especially if many contacts were assigned to that stage — because all movements to and from that stage are deleted from the logs and no longer appear in reports. After a deletion, you may see unusual data until the system stabilizes with the new stage configuration.
The Lifecycle Transitions Log works differently. Past rows for a deleted stage stay in the log, and the stage name shows as “Deleted”. Reassigning Contacts when you delete a stage doesn't add new rows.
Recommended Steps:
Verify Post-Import Updates – If imported contacts appear to distort your metrics, check that any manual or automated updates afterward are properly logged.
Minimize Large-Scale Stage Changes – Frequent additions, deletions, or re-sequencing of stages can lead to inconsistent data.
Allow a “Cooling Period” – If you do make significant stage changes or bulk imports, let the data settle before drawing conclusions about your metrics.
Why do some leads show “No Source” in Lifecycle Reports?
A lead will show as “No Source” when its creation method isn’t tracked under any defined source category. This typically happens for:
Contacts created before Lifecycle Reports were introduced.
Contacts added through channels like Incoming Call, Echo Message, or Telnyx Voice
Why are the ad columns blank for some Contacts?
The Ad Campaign, Ad Group, and Ads columns are blank when the Contact didn't come from a paid ad.
They can also be blank for Contacts from Meta ads. Meta sometimes doesn't return ad details when the Contact is created, for example when the ad is no longer available.


